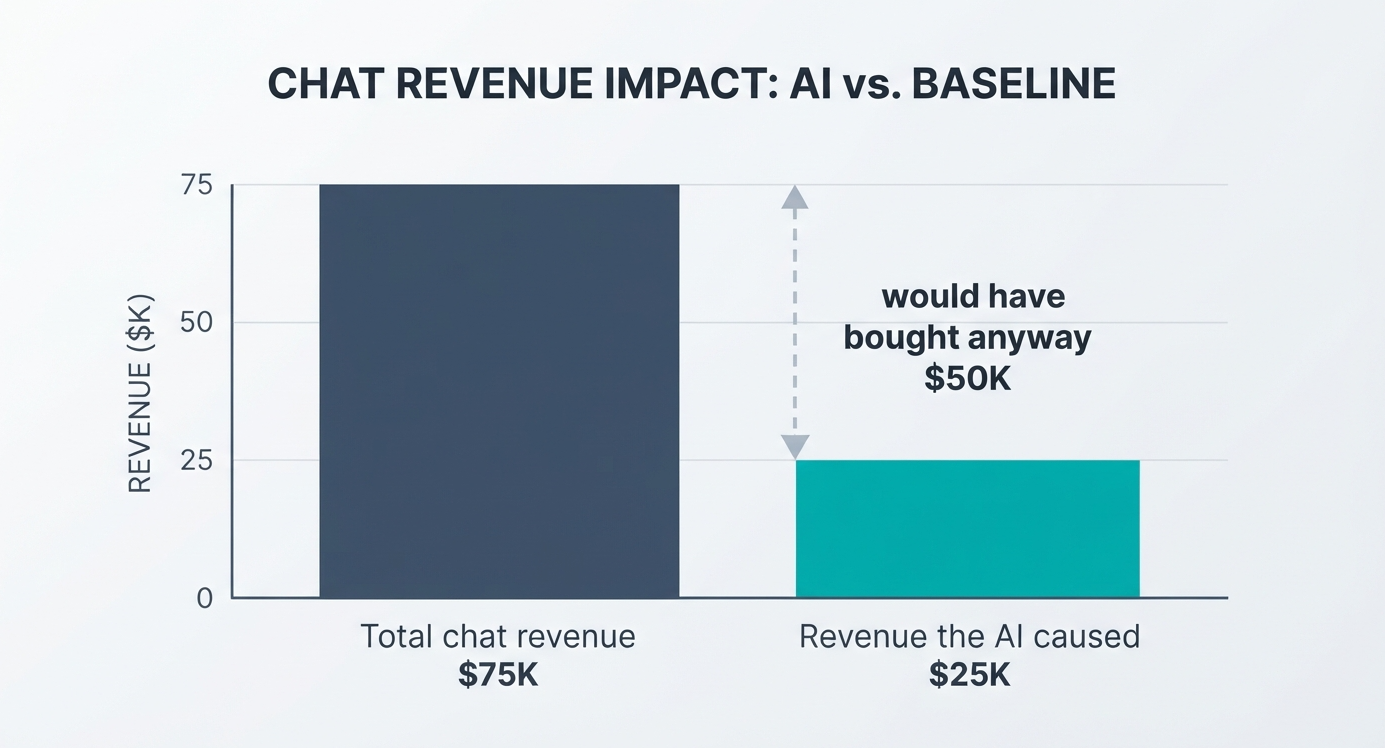
Most chatbot dashboards make the AI look better than it is. They count every order from anyone who opened the widget, including the shopper who asked about returns and was going to buy anyway.
Good chatbot analytics fix that. They separate conversations that changed a purchase from conversations that happened near one. And they hold up when a finance lead or a client asks the obvious question: would that sale have happened without the AI?
Chatbot analytics are the revenue, conversation, and support numbers that show what an AI agent does for a store. In ecommerce, four carry the weight: attributed revenue split by influence level, chat-to-sale rate read against your sitewide rate, escalation rate, and off-hours coverage. A before/after test turns them into proof.
This guide owns the measurement side. If you still need the business case for buying an AI agent at all, read our breakdown of conversational AI ROI first, then come back here to prove it.
Which chatbot metrics matter for an ecommerce store?
Eleven numbers, in three groups. Everything else on a dashboard is either a usage count or a by-product of these.
| Group | Metric | What it tells you | Read it with care when… |
|---|
| Revenue | Attributed revenue, by influence level | How much revenue followed a conversation, and how strongly the AI shaped it | You report the total and skip the split |
| Revenue | Chat-to-sale rate | Share of chats that end in a purchase | Post-purchase chats are mixed in |
| Revenue | Orders involving a conversation | Volume behind the revenue figure | One big order skews a small month |
| Revenue | AOV of chat buyers | Whether chat buyers spend more | You forget chatters were more motivated to begin with |
| Conversation | Chats started | Demand for answers | Traffic changed that month |
| Conversation | Topic mix (discovery, conversion, post-purchase) | Why people open the chat | A launch or delay shifts the mix |
| Conversation | Pages that trigger chats | Where shoppers get stuck | A page got more traffic, not more confusion |
| Conversation | Top questions and conversion blockers | What stops people buying | You read the list but never act on it |
| Support | Escalation rate | Share of chats handed to a person | It drops to near zero (that’s a warning) |
| Support | Off-hours share | Conversations and sales while your team is offline | Business hours aren’t set correctly |
| Support | Reply quality ratings | Whether answers helped | Ratings come from a small sample |
Leave “total AI replies” out of any report a stakeholder reads. It tells you about your plan limit, not about value.
The conversation group is where the customer insights live. Revenue proves the AI pays for itself; the questions and blockers tell you what to fix next. That’s how chatbot analytics improve the customer experience: the data points to the exact page or answer that’s failing.
These seven metrics explain why revenue moves. None of them proves revenue on its own, so use them to measure chatbot performance when one of the eleven above slips.
| Metric | What it measures | When it slips |
|---|
| Response time | How long shoppers wait for each reply. Watch it live in conversation monitoring, and trace slow replies in message-level analysis | Check slow integrations and replies that run too long |
| Fallback rate | How often the AI can’t answer. In Zipchat, these show up as missed questions and FAQ gaps in “What customers ask” | Read the failed messages and add the missing answers |
| Missed questions | The exact questions behind the fallback rate. Pending corrections on the dashboard status card show which fixes you’ve written but not yet applied | Group them by topic and fix the biggest group first |
| Abandonment rate | Chats that end with no answer and no purchase. Read them next to conversion blockers to see where shoppers gave up | Check where they drop off: a long form, a slow lookup, a vague reply |
| Goal completion rate (GCR) | How often a task finishes, such as an order lookup or a size recommendation. A “Bad” reply rating on that task usually marks a failure | Test that task end to end in your own chat |
| Average chat duration | How long conversations run. Long chats that end in products searched but not found usually mean a stuck shopper, not an engaged one | Read it with the outcome: long can mean engaged or stuck |
| Customer satisfaction | Zipchat’s reply quality ratings (Great / Good / Bad). The share of “Bad” ratings is the number to watch, not the average | Read the lowest-rated transcripts first |
Chatbot analytics can identify gaps in training data by analyzing persistent fallback rates. If the same user message keeps failing, the AI is missing content, not intelligence. Tracking those missed questions is how you refine the AI’s understanding over time.
Real-time analytics give you an immediate read on chatbot performance. Zipchat’s live conversation monitoring shows chatbot interactions as they happen, which helps most on launch day or during a sale.
How does a dashboard attribute a sale to an AI conversation?
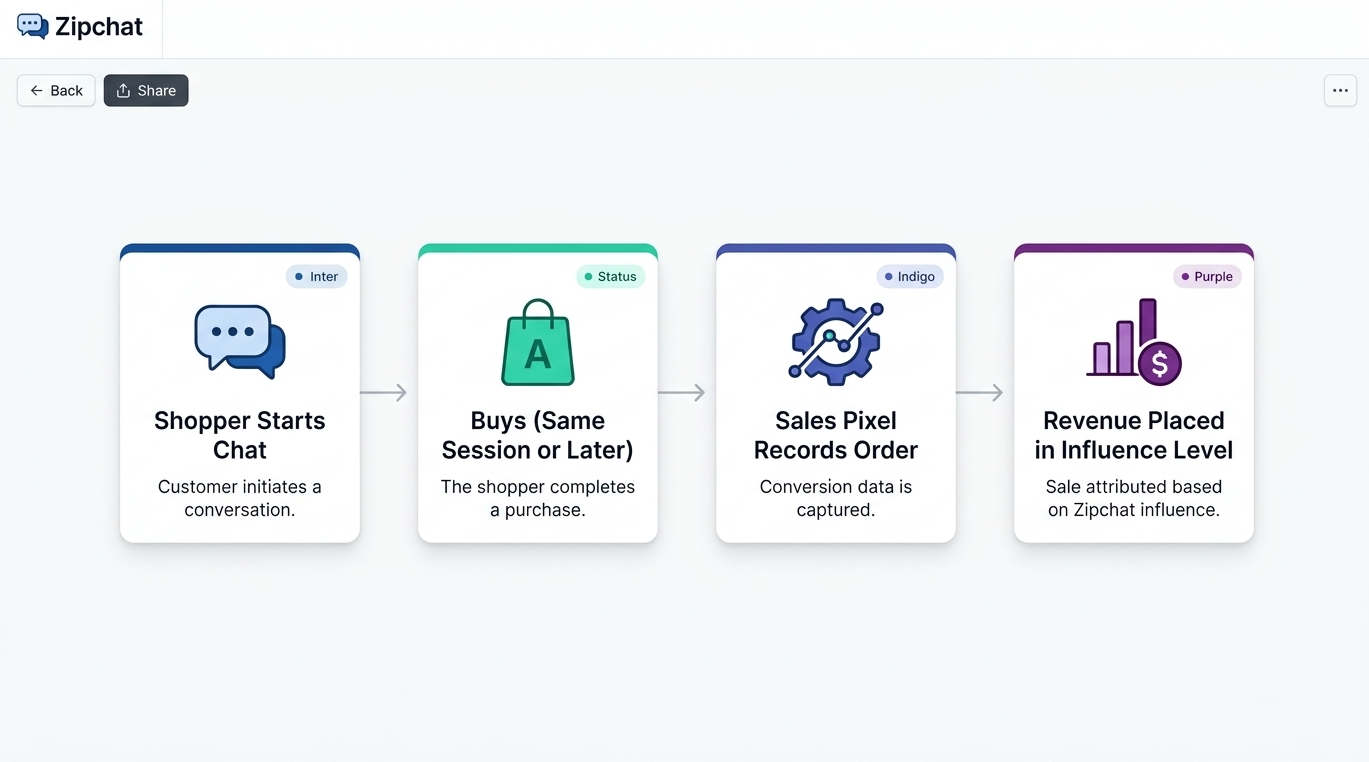
A dashboard links an order to a conversation when the same shopper chatted and then bought. The link usually comes from a tracking pixel on the order confirmation step, matched to the visitor who had the conversation.
Here’s how it works in Zipchat:
- A shopper starts a conversation on your site.
- The shopper buys in the same session or later.
- Zipchat’s sales pixel records the purchase and attributes it to the conversation that led to it.
- The dashboard places that revenue in an influence level, from light touch to strong influence, based on what happened in the chat.
On selected channels, Zipchat also supports offsite purchase attribution. That covers the shopper who asks about sizing in a messaging channel and buys on your site afterwards.
Zipchat’s influence levels
Influence levels are the answer to “the AI was there, but did it matter?” A shopper who asked when the warehouse ships and then checked out sits at the light end. A shopper who asked which jacket fits a wide frame, got a recommendation, and bought that jacket sits at the strong end.
That split is what makes the revenue number defensible. You can put strong-influence revenue in the headline and show lighter levels underneath, instead of one large total nobody trusts.
Attribution models compared
No single model is right for every report. Pick the one that matches the question you’re answering.
| Model | Question it answers | Main risk |
|---|
| Any-touch (“sales involving a conversation”) | How much revenue came from shoppers who chatted? | Counts sales that would have happened anyway |
| Last-touch chat | Was the chat the final step before purchase? | Ignores research chats days earlier |
| Influence-weighted | How much did the conversation shape the purchase? | Depends on the rules behind each level |
| Incrementality test (before/after or holdout) | What revenue exists only because the AI is on? | Needs enough traffic and a clean test window |
Use influence-weighted revenue month to month. Run an incrementality test once a quarter to check it.
How do you tell sales the AI caused from sales that would have happened anyway?
You need two things: influence levels for the day-to-day view, and a before/after test that measures lift directly. A prospect asked us this exact question on a sales call, and it’s the right one to ask.
Attribution tells you a conversation came before a sale. It can’t tell you the sale needed it. Only a comparison against a version of your store without the AI can do that.
A before/after test you can run this month
- Pick two matched page groups. Split collections or product pages into two sets with similar traffic and conversion history. Choose collections shoppers rarely browse together (outerwear and swimwear, not two kinds of jacket), so one visit doesn’t cross both groups. Zipchat’s page visibility rules let you show the widget on one set and hide it on the other.
- Record a baseline. Take four weeks of data for both groups before you change anything: sessions, orders, revenue.
- Turn the AI on for the test group only. Leave the control group without chat.
- Run at least two full weeks. Avoid sales events, launches, and holiday peaks. A promo on one group ruins the comparison.
- Compare revenue per visitor, not chat metrics. You’re measuring the whole page group, chatters and non-chatters together.
- Swap the groups and repeat. If the lift shows up both ways, you can trust it.
Revenue per visitor (RPV)  = revenue ÷ sessions
Incremental revenue        = (RPV test − RPV control) × sessions on test pages
A worked example
These are inputs for the arithmetic, not benchmarks.
| Control pages (no chat) | Test pages (chat on) |
|---|
| Sessions | 40,000 | 40,000 |
| Revenue | $72,000 | $82,000 |
| RPV | $1.80 | $2.05 |
| Incremental revenue | | $10,000 |
Now open the dashboard for the same pages and dates. Say total attributed revenue reads $26,000, and strong-influence revenue reads $11,500.
The test found $10,000 of lift. That sits close to the strong-influence figure and far from the total. So strong influence is the number to put in your headline, and you’ve got the test to back it.
When the test and the dashboard disagree
If measured lift is well below strong-influence revenue, check the test first. Uneven traffic, a promo, or a stock-out on one group will skew it.
If lift is above the total attributed figure, the AI is probably helping people who never open it. That happens when other shoppers see a better product page because you fixed the FAQ gap the AI surfaced.
What is chat-to-sale rate and how should you read it?
Chat-to-sale rate is the share of conversations that end in a purchase. It’s the first number most merchants look for, and the easiest one to misread.
Chat-to-sale rate = orders attributed to a conversation ÷ conversations
It will almost always beat your sitewide conversion rate. People who open a chat are already interested, so part of that gap is self-selection and not the AI’s doing. Never put the two side by side without saying so.
Read it in three cuts instead:
- By topic. Discovery and conversion chats should convert. Post-purchase chats (“where’s my order?”) come from people who already bought, so take them out.
- By page. A low rate on one product page usually points to a question the AI can’t answer yet.
- Over time. The trend after you add a knowledge base correction matters more than any single month.
For a public reference, Ring Automotive reached a 12% conversion rate with higher AOV after launching Zipchat (success story). Treat it as one store’s outcome, not a target for yours.
Which support metrics still matter?
Revenue gets the attention, but support numbers explain it. Three of them belong in every report, even for teams that bought the AI to sell.
Escalation rate
Escalation rate = conversations handed to a person ÷ total conversations
A falling escalation rate is good until it gets too low. If almost nothing escalates, the AI may be answering refund disputes it should pass on. Read ten escalated and ten non-escalated transcripts each month to check.
A high AI resolution rate is achievable, but it follows knowledge coverage. Each correction you add to the knowledge base closes one more question the AI used to pass on.
Off-hours coverage
Zipchat reports split conversations into business hours and off-hours. This is the clearest evidence you have. Nobody on your team was there, so a sale after an off-hours chat had no human help to compete with.
Set your business hours correctly in the agent’s settings before you trust this split. Otherwise, every chat lands in the wrong bucket.
Topic mix
Zipchat’s reports group conversations by topic: discovery, conversion, and post-purchase. The mix tells you what job the AI is doing.
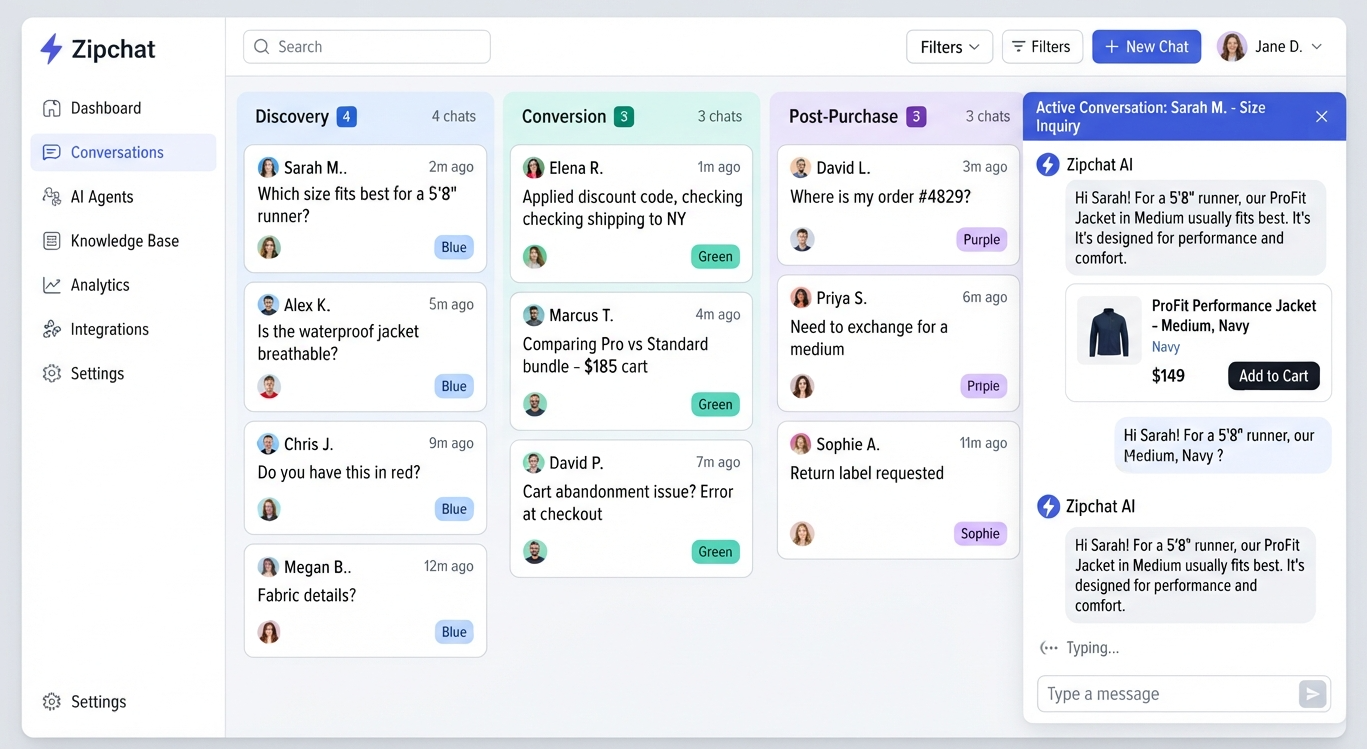
A store where most chats are post-purchase is running a support agent, and should report on deflection. A store heavy on discovery is running a sales assistant, and should report on revenue. For the support side in detail, see our guide to customer service metrics.
What to read first in a chatbot report
Start with the influence split, not the total. Then check off-hours sales, then the top conversion blockers. That order goes from “is it working?” to “what do we fix?” in three steps.
Chatbot analytics dashboards show key metrics over time, so compare each figure with last month and the same month last year. A single month on its own proves little.
A report should answer one question in its first line: did the AI earn its cost this month? Everything below that line supports it.
Zipchat produces monthly reports with performance summaries, top questions, conversion blockers, and trending topics. You can share them through a public link, which saves agencies from rebuilding slides for every client.
A reporting template
| Section | What goes in it | Where it comes from |
|---|
| 1. Headline | Strong-influence revenue, AI cost, ROI on gross margin | Dashboard, billing, your margin |
| 2. Proof | Latest before/after or holdout result, with dates | Your test sheet |
| 3. Revenue | Attributed revenue by influence level, orders, AOV of chat buyers | Dashboard |
| 4. Conversations | Chats started, topic mix, chat-to-sale rate by topic | Dashboard, reports |
| 5. Support | Escalation rate, off-hours share, reply quality | Dashboard, reports |
| 6. What shoppers asked | Top questions, conversion blockers, products searched but not found | Monthly report |
| 7. Next month | Two or three changes, each tied to a finding above | You |
Section 7 is where most reports fall short. If blockers show shoppers asking about sizing on one collection, the action is a size guide on that collection. Our list of A/B test ideas from chat transcripts turns those findings into tests.
How to calculate chatbot ROI
Use gross profit, not revenue. A $10,000 lift at a 40% margin is $4,000 of profit, and that’s what pays the bill.
Chatbot ROI = (incremental gross profit + support cost saved − AI cost) ÷ AI cost
Support cost saved comes from conversations the AI resolved that would otherwise reach an agent. Count it, but keep it separate from sales so nobody suspects double counting. The ROI calculator gives you a starting estimate before you have your own data.
For a public reference point, Shelly reports 8-12x monthly ROI from AI-powered product guidance with Zipchat (success story). That’s one store’s result, measured its own way, so compare its method with yours before you compare the multiple.
How to compare chatbot ROI for retail stores
When an agency compares two retail clients, or a merchant compares two vendors, put the numbers on the same basis first:
- Same model. Influence-weighted against influence-weighted, never one vendor’s any-touch total against another’s last-touch figure.
- Same cost base. Include setup hours and staff time spent on training, not the subscription alone.
- Same margin. A jewelry store and a grocery store can show the same revenue lift and wildly different profit.
- Same season. Compare November to November, not November to March.
Mistakes that inflate chatbot ROI
Reporting “sales involving a conversation” as AI revenue
It’s the biggest number on the dashboard, so it ends up in the slide. Then someone asks about the shopper who chatted about returns, and the whole report loses credibility. Lead with strong influence.
Counting post-purchase chats in conversion rate
Order-status chats come from people who already paid. Left in, they drag chat-to-sale rate down; counted as sales, they push revenue up. Filter by topic before you calculate.
A sitewide sale lifts both groups and drowns the signal. If a promo lands mid-test, discard the test and run it again.
Ignoring support savings
This one deflates ROI. Teams that bought the AI for sales often forget the tickets it closed. Off-hours answers alone can cover a share of the cost.
When chatbot analytics can’t prove much
| Condition | What happens | What to do |
|---|
| Your weekly RPV swings more than the lift you expect (check your last eight weeks) | Week-to-week noise swamps the lift | Run the test longer, or add pages to each group, until the gap between groups beats your normal week-to-week swing. Until then, rely on influence levels and off-hours sales |
| Shoppers move between test and control pages in one visit | A shopper chats on a test page, then buys from a control page. The control group borrows the AI’s effect, and measured lift shrinks | Split by collections shoppers rarely cross-browse, and assign each order to the group where the session started |
| A promo or launch every couple of weeks | No clean test window | Test on evergreen collections that sit outside promotions |
| Long buying cycles (furniture, high-end electronics) | Purchases land after the attribution window | Track assisted conversions and repeat visits as well |
| Most sales happen in-store or on marketplaces | The pixel can’t see the purchase | Measure on-site lead capture and offsite channels where attribution is supported |
| Widget hidden on mobile | You’re measuring desktop only | Turn it on for mobile before you judge the results |
Where chatbot measurement is heading
Shoppers increasingly ask questions where your site can’t see them: in messaging apps, social DMs, and AI assistants. A pixel on the confirmation page only catches the end of that journey.
That’s why offsite attribution matters more each year. Expect the reports that win budget arguments to combine three things: influence-weighted attribution across channels, a regular incrementality test, and transcript findings that turn into site changes.
Total chat revenue will stop being the headline. Lift will replace it.
Frequently asked questions
What are chatbot analytics?
Chatbot analytics measure user interactions, satisfaction scores, and the business results a chatbot drives. In ecommerce, that means attributed revenue, chat-to-sale rate, conversation topics, escalation rate, and off-hours coverage. Together, they show whether the AI sells, supports customers, and pays for itself.
How do you measure chatbot ROI?
Take the incremental gross profit the chatbot created, add the support cost it saved, subtract what the chatbot costs, then divide by that cost. Use a before/after or holdout test to find the incremental part. Total attributed revenue overstates it, because some shoppers would have bought anyway.
What is a good chatbot conversion rate?
There’s no universal number, because stores, prices, and traffic differ too much. A good chat-to-sale rate clearly beats your own sitewide conversion rate on the same pages and keeps improving. Remove post-purchase chats first, since those shoppers already bought and drag the rate down.
How are sales attributed to a chatbot?
A tracking pixel records the purchase and links it to the conversation the same shopper had beforehand. Zipchat attributes each purchase to the conversation that led to it, then splits influenced revenue into levels from light touch to strong influence. Selected channels also support offsite purchase attribution.
What KPIs should I track for an AI agent?
Track strong-influence revenue, chat-to-sale rate by topic, orders and AOV from chat buyers, escalation rate, off-hours conversations and sales, and reply quality ratings. Add top questions and conversion blockers each month. Those last two don’t prove revenue, but they show what to fix next.
Your first proof takes two weeks
Pick two matched page groups this week and hide the widget on one. Two weeks later, you’ll have a lift figure to hold against the dashboard, and that turns every future report from a claim into evidence.
While the test runs, set your business hours and filter post-purchase chats out of your conversion rate. Then see what your conversations reveal on the customer insights page, or start the 7-day free trial and run the test on your own store.
 Website chat Turns browsers into buyers on every page.
 WhatsApp Sell on the app your customers read.
 Instagram Answers every DM in seconds.
 Messenger Turns Facebook ad questions into sales.
 Email Answers every email in the same thread.