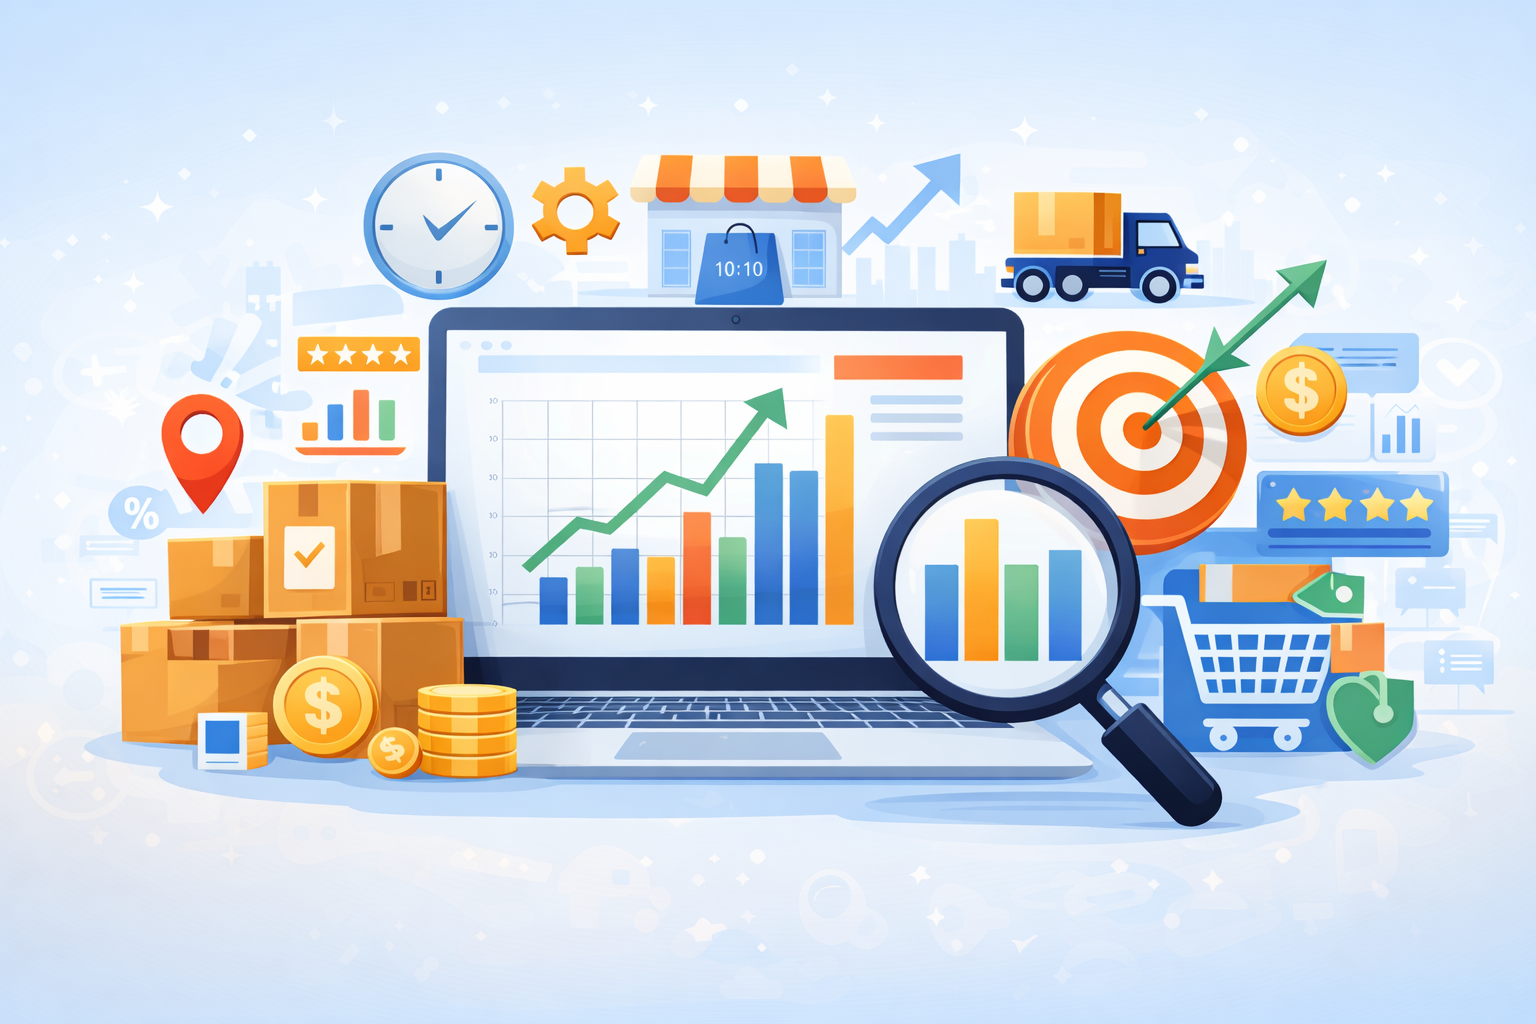
It takes more than opening a website to own and operate a successful online store. If you want to scale an ecommerce business in a smart, sustainable way, you must track your performance with key ecommerce performance indicators (KPIs).
These are specific numbers that indicate how the coverage is performing and where there’s work needed. The right ecommerce Key Performance Indicators enable you to track what’s working, catch problems early, and make decisions based on real data rather than pure guesswork.
In ecommerce, KPIs are the lifeblood of your business. They help you determine whether or not your ecommerce store is achieving its goals, whether to increase sales, keep customers coming back again and again, improve your checkout experience, grow lifetime value, or something else. They are not just words on the page; they’re measurements of success and growth for your online business.
In this guide, we’re covering the essential ecommerce KPIs that you want to track in 2026 (and long after), what each one means, and how they can provide insights that inform better decisions across marketing, sales, customer experience, and operations.
We’ll also explore how modern tools and AI-driven solutions like Zipchat make it easy for ecommerce teams to surface the right data, keep an eye on performance trends, and take insights to action.
Key Takeaways
Ecommerce KPIs are objective-based performance metrics. They allow you to gauge progress on revenue, profitability, retention, and operational goals.
KPIs are not metrics. Metrics measure activity; KPIs measure the progress toward key business objectives.
There are various types of KPIs on the basis of which it plays different roles. When you look at revenue, retention, conversions and marketing/order/support KPIs, each of these tells a different part of the story for your store.
KPIs will vary as the business grows. New stores optimize for acquisition and cash flow, while older brands are much more focused on profitability and retention.
It’s all about data-driven decision-making using ecommerce KPIs. No more guessing, you can see your issues, trends, and performance with clarity.
Modern tools simplify KPI tracking. With tools and AI-powered solutions for analytics, teams can monitor their performance without slogging through spreadsheets.
What Are Ecommerce KPIs?
Key Performance Indicators (KPIs) for ecommerce are the most important metrics used to track the performance of your ecommerce business. That’s the simple definition.
Not every number on your dashboard is a KPI. A KPI is a metric that clearly indicates whether your company is progressing toward an established goal. For instance, boosting revenue, increasing retention, raising profit margins, or reducing churn.
For example:
Website traffic is a metric.
Revenue growth from that traffic may be a KPI.
The difference matters.
Ecommerce KPIs vs. Ecommerce Metrics
Ecommerce metrics measure activity. They’re telling you what’s happening in your store. These can be things like page views, email open rates, or orders in total.
Ecommerce KPIs take it one step beyond. They link those measures to business results. They answer questions like:
Are we becoming more profitable?
Are customers staying longer?
Is our marketing efficient?
Are we converting visitors effectively?
So, all KPIs are metrics, but not all metrics are KPIs.
By tracking ecommerce KPIs, businesses get visibility into how they’re doing across sales and customer acquisition and retention, so that leaders can make smarter growth decisions rather than reacting to headlines (Stripe).
The key is alignment. A number is only a KPI if it is related to a defined business goal. Without that connection, it’s just data.
As we go through the various ecommerce KPIs to monitor, you’ll see how each of them ties directly into growth, profit, and long-term success.
Importance of Tracking Ecommerce KPIs
It’s not about mining more data for ecommerce KPI tracking. It’s concentrating on the numbers that create ecommerce growth.
Here’s why ecommerce KPIs matter:
Measure progress
KPIs tell you whether or not you are progressing toward your revenue, profitability, and retention targets. Without them, growth becomes guesswork.
Identify issues early
A sudden reduction in conversion rate or an abnormal increase in cost of acquisition can warn that there’s a problem before you begin losing money.
Spot trends and patterns
By tracking KPIs over time, you can also see seasonality in performance, variations in campaign performance, and long-term changes in behaviour.
Make data-driven decisions
At a very high-level, ecommerce managers don't have to rely on their gut; they can now make changes to pricing, marketing spend, or user experience depending upon what the numbers are telling them."
Types of Ecommerce KPIs
Not all KPIs serve the same purpose. Various KPIs respond to various business issues.
For clarity, I’ll categorise ecommerce KPIs and then go into details about the type of metrics each one contains.
Key Financial Metrics and KPIs -Track financial health and sustainable growth.
Retention and Customer Satisfaction KPIs – Demonstrate long-term customer loyalty and value.
Ecommerce Conversion KPIs – Monitor the rate of website visitors who convert to buyers.
Marketing & Site Performance KPIs -Measure traffic quality and marketing campaign effectiveness.
Customer Support KPIs -Track service level and the role it plays in retention.
This framework can help ecommerce managers find the right KPIs that should be on top of their list, considering their team dynamics, growth stages, and revenue model.
Revenue and Profitability KPIs
Revenue keeps your store running. It stays alive long-term because there’s profit in it.
Your revenue and profitability KPIs tell you if and by how much your ecommerce website is growing sustainably (producing not only sales but also healthy margins), or unsustainable growth (making a lot of transactions, but very little profit).
Overall Ecommerce Sales
The overall sales measure the total revenue generated in a specified time period (day, week, month, quarter, and year).
Formula:
Total Sales = Sum of all values in orders completed during a period
This KPI shows top-line growth. If sales grow continuously, it means that demand has become stronger, marketing efforts have become successful, or conversion rates have risen. That said, increased sales don’t necessarily equal a profit, so when tracking this KPI, it’s recommended you also compare against margin and acquisition costs.
This increased average order value (AOV) indicates that customers are spending more per purchase. Usually, it indicates great upsell, bundle, or cross-sell tactics.
Higher AOV drives revenue up without the need for more traffic, which is why it’s one of the most effective ecommerce KPI to monitor.
Revenue Per Visitor (RPV)
It is another metric for the income generation potential of a visitor to your site.
Formula:
RPV= Total revenue / Total visitors
RPV consolidates both the quality of traffic plus conversion into one number. If traffic goes up, but RPV goes down, it could be that you are getting lower-quality traffic or failing to convert.
This is particularly helpful in measuring paid campaigns and marketing strategies.
Gross Margin
Gross margin is the amount of money left over after the cost of goods sold (COGS) has been subtracted from the revenue.
This KPI provides clarity on the profitability of each product. Sales can grow quickly at a store and still fail if the profits per sale are too slim (Conjura).
Solid gross margins provide ecommerce brands with opportunities to invest in marketing, support, and innovation.
Retention and Customer Satisfaction KPIs
Acquiring customers is expensive. Keeping them is profitable.
Retention and satisfaction KPIs gauge how effectively your store creates loyalty and long-term value. The pair is one of the most powerful drivers of sustainable e-commerce growth.
Customer Lifetime Value (CLV)
Customer Lifetime Value forecasts the total amount of money that a company is likely to extract from a customer during their entire relationship.
A simplified formula:
CLV = Average Order Value × Purchase Frequency × Customer Lifespan
High CLV means healthy retention, repeat purchase, and brand loyalty. Growth becomes scalable only when CLV surpasses the cost of acquisition.
Customer Acquisition Cost (CAC)
CAC Calculation: CAC (Customer Acquisition Cost) is the cost of acquiring a customer.
Formula:
CAC = Total Marketing & Sales Spend / Number of New Customers Acquired
When CAC grows more quickly than CLV, it becomes less profitable. Observing the CAC allows ecommerce teams to tailor ad spend and campaign approaches.
Customer Retention Rate
Customer Retention Rate is the number of returning customers expressed as a percentage of all the existing ones.
A high retention rate indicates good customer experience, product satisfaction, and brand loyalty.
Customer Satisfaction Score (CSAT)
CSAT (Customer Satisfaction Score) is a score that measures how satisfied customers are with a product, service, or interaction.
It's usually derived from post-purchase or post-support surveys:
CSAT = (No. of Satisfied Responses / Total Responses) × 100
High CSAT means good customer experience, and that has a significant impact on retention, reviews, and word-of-mouth referrals.
Ecommerce Conversion KPIs
Conversion KPIs make you aware of how efficiently your online shop converts people visiting the site to actual customers. Small changes in these metrics can make a disproportionate difference to revenue with no change in traffic.
Cart Abandonment Rate
Cart abandonment rate is the percentage of people who put something in a cart and then never take action to purchase it.
A low rate typically indicates payment friction, technical mistakes, or a lack of trust.
Conversion Rate
Conversion rate is the percentage of visitors to your site who end up making a purchase.
Formula:
Conversion Rate = (Orders / Visitors) × 100 OR (Number of Orders / Total Visitors) × 100
This is one of the most important ecommerce KPIs to monitor since it shows how well your website experience, product offering, and marketing alignment are doing collectively. It is useful to optimize the efficiency of the funnel, since it is a valuable tool for making successful conversions in ecommerce by determining drop-off points (Piwik).
And if you want to optimize how these conversion KPIs are doing, check here.
Marketing and Website Performance KPIs
Marketing and website performance KPIs are used for ecommerce teams to help gauge traffic quality, campaign success, and on-site engagement. These numbers indicate if your marketing spend is getting the right audience, and whether you are converting that attention into meaningful action on your website.
Website Traffic
Traffic is how many people visited your store in a certain time frame. This KPI is normally monitored through analytics platforms, with the ability to disaggregate by channel (organic search, paid ads, email, social, and direct).
High traffic volume is an indicator of good brand awareness or campaign reach, but it’s not always the case that visitors turn into sales. If traffic increases and revenue does not, maybe targeting is bad, or there is friction in conversion.
Traffic should always be measured alongside conversion and revenue metrics to fully gauge the business impact (Stripe).
Bounce Rates
Bounce rate is the percentage of people who leave your site after viewing only one page.
Formula:
Bounce Rate = (Single-Page Sessions ÷ Total Sessions) × 100
A high bounce rate can also be a signal of slow page load times, irrelevant traffic, or poor messaging (so the visitor immediately knows he’s in the wrong place), or simply bad user experience.
However, context matters. A blog post will have a higher bounce rate than a product page inherently. Ecommerce managers need to look at bounce rate in conjunction with time on page and overall conversion behaviour.
Mobile Traffic
Mobile traffic is the proportion of your customers visiting using a mobile device.
Formula:
Mobile Traffic % = (Mobile Sessions / Total Sessions) x 100
As mobile commerce expands, this KPI shows whether your store experience is smartphone optimized. If there’s a high amount of mobile traffic, but a poor mobile conversion rate, it might indicate browsing or checkout usability issues.
This KPI should be tracked to prioritize responsiveness design, speed optimization, and mobile-friendly checkout flows.
Click-Through Rate (CTR)
The click-through rate (CTR) is the ratio of users who click on a specific link to the number of total users who view a page, email, or advertisement.
Formula:
CTR = (Clicks ÷ Impressions) × 100
CTR is typically used to measure paid ads, email campaigns, and search engine listings.
A high CTR suggests that messaging, targeting, and creative are resonating with your audience. A low CTR may indicate weak headlines, unclear value propositions, or poor audience targeting.
This is a crucial KPI to help fine-tune marketing spend and result in campaign efficiency.
Ecommerce Customer Support KPIs
Customer service is no longer a cost center. It directly influences repeat purchase rates, retention, and brand perception.
Support KPIs indicate how well your team is resolving customer issues, and thus influencing satisfaction, loyalty, and lifetime value.
First Response Time (FRT)
A First Response Time is the time it takes for a support team to reply to a customer’s or user’s first incoming message.
Formula:
FRT = Sum of Time to First Responses ÷ Number of Support Tickets
The faster you reply to them, the more they trust you and the less frustrated they get. High response times are the reason some carts don’t get followed through with, or end up being negative reviews. Also, First Response Time improves customer trust and retention.
First Contact Resolution (FCR)
First Contact Resolution is the rate at which all customer support problems are resolved within the first interaction.
Formula:
FCR = (Tickets Resolved Within First Interaction / Total Tickets) * 100
A high First Contact Resolution shows good support processes and well-educated staff. It decreases follow-up rates, increases satisfaction, and reduces support costs.
Resolution Time
Resolution Time serves as a benchmark for the mean time it takes to successfully resolve customer support issues.
Formula:
A time to resolve = Total duration of resolution to all tickets / Number of Tickets
Reducing the time it takes to resolve issues results in a better customer experience and less strain on operations. If your resolution times are consistently long, it could be indicative of workflow issues or other staffing problems.
Average Handle Time (AHT)
Average Handle Time is how long a support agent spends working on a customer interaction, including both the talk time plus any follow-up work.
Formula:
AHT = Total Handling Time / Total Interactions
Average Handle Time tracking can help you strike the right balance between speed and quality. Too low AHT can represent a hurried assistance, whereas too high AHT may indicate process waste.
The level of support you offer heavily influences how likely customers are to come back, so these KPIs are critical for the growth of ecommerce sites.
How Ecommerce KPIs Differ by Store Size, Business Model, and Growth Stage
Ecommerce KPIs are not static. Their significance changes depending on your store’s size, type of business, and its growth stage.
Stores in their early stages tend to prioritize traffic, conversion rate, and cash flow. They are focused on proving demand and driving consistent revenue.
Brands in the growth stage start to focus on cost per acquisition (CPA), lifetime value of a customer, and retention. The main goal becomes scaling sustainably.
For mature or enterprise stores, the focus moves to profitability, optimizing your margins and operating efficiently. Business models also matter. A subscription store might prioritize retention and churn rate. A high-ticket B2B ecommerce brand would be more concerned with things like average order value and lifetime value.
Bottom line: the best ecommerce KPIs to track will vary depending on your immediate goal. Where your business changes, so should your KPI focus.
Using Tools To Improve KPI Tracking
The truth is, manually handling e-commerce KPIs on spreadsheets can become overwhelming. That is why today's online sellers use analytics platforms, marketing dashboards, automation software, and CRM systems to aggregate performance data.
These tools help:
Aggregate data from multiple channels
Visualize performance trends
Automate reporting
Identify anomalies in real time
Tools powered by AI provide yet another layer of valuable insight. Rather than simply placing numbers, they help teams to audit patterns and bring value-extractable insights to the surface.
For instance, tools such as Zipchat grant ecommerce companies visibility into customer conversations, support trends and engagement behavior, linking service performance to retention and revenue KPIs.
Instead of replacing analytics platforms, they make them better by transforming raw data into actionable intelligence. The reward is less manual reporting and more time shifting to focus on growing.
Conclusion
It is important for the sustainable growth of your business to monitor the correct ecommerce KPIs. These metrics enable you to track progress, identify holes in your process, ensure peak performance, and make the best decisions across marketing, sales, operations, and customer support.
But KPIs are not one-size-fits-all. Your priorities shift as you scale your shop. Traffic and conversion are what early-stage brands may zero in on. Growing brands track cost of acquisition and lifetime value and focus on margin and operational efficiency.
The best ecommerce teams are in the habit of reviewing numbers with the frequency that matches their goals at any given time.