Try Zipchat in Action!
Enter your store URL to see how Zipchat would behave.


Average Order Value (AOV): Definition, Formula & Calculation

You just made $5,000 in sales yesterday, that's awesome! But here’s the real question: were those 500 small orders or 50 big ones? That’s the story Average Order Value (AOV) tells. It’s one of the simplest, yet most powerful metrics for understanding how efficiently your online business turns clicks into revenue.
What Is AOV?
Average Order Value (AOV) is the measure of the average dollar amount customers spend per order on your ecommerce site. It helps you evaluate product pricing strategy, upsells, and marketing ROI in the same way metrics like ecommerce conversion rate (CVR) and revenue per visitor (RPV) show how efficiently your store performs.
Calculating Average Order
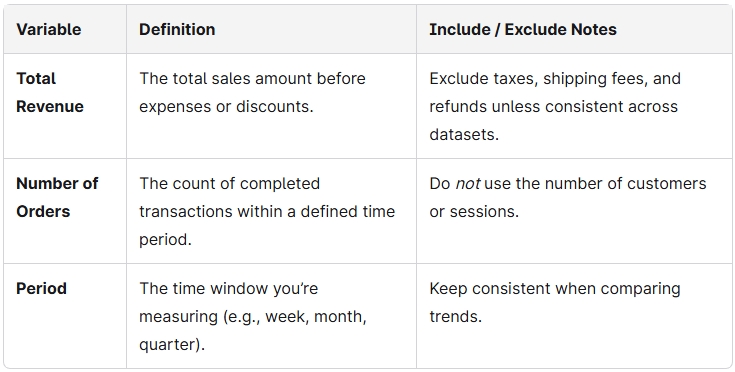
Calculating Average Order Value (AOV) may be simple math, but interpreting it correctly makes all the difference. AOV tells you the average dollar amount each customer spends per transaction, not per the money customers spend or session.
Average Order Value Formula
AOV = Total Revenue ÷ Number of Orders
Example:
If your store made $15,000 from 300 orders in one month, your AOV = $50.
That means, by simply dividing total revenue by the number of orders, we get the average revenue of every checkout which is $50. This is a useful complement to other pricing metrics like average selling price (ASP).
Variable Reference Table
Common Mistakes to Avoid
- Mixing up customers with orders: AOV is per order, not per shopper.
- Inconsistent refund handling: Always include or exclude refunds consistently across reports.
- Combining currencies: Convert all amounts into a single currency before calculating.
Does AOV Include Shipping, Tax, Discounts, and Refunds? (Gross vs. Net AOV)
When calculating Average Order Value (AOV), clarity matters. Should you include shipping fees and taxes? What about discounts or refunded purchases?
The answer depends on whether you’re using Gross AOV or Net AOV, so mixing them up can seriously distort your data.
Here’s the breakdown:
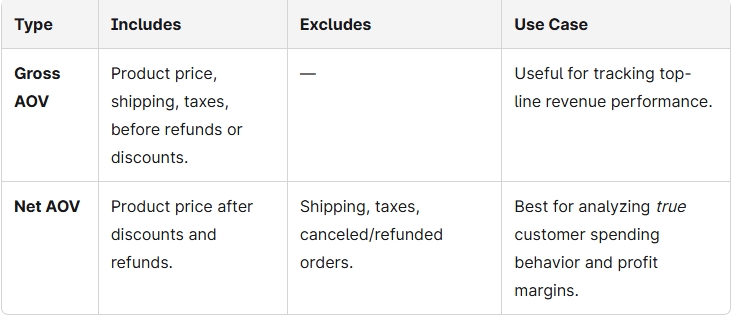
Zipchat uses Net AOV in all examples, since it more accurately reflects customer value and campaign ROI. When comparing AOV trends, it is important to keep your calculation method consistent. This is because switching between gross and net values can make your performance look artificially inflated (or worse, deflated).
And remember: A high Net AOV with a rising cart abandonment rate may signal that product customers are adding more to their carts but hesitating at checkout, which presents a conversion opportunity worth exploring.
Where to Find AOV in Shopify, GA4, and Other Ecommerce Businesses
You don’t need a spreadsheet to track your Average Order Value (AOV). Most major eCommerce platforms already calculate it for you. Here’s where to find it in your favorite tools:
Shopify
- Go to Analytics → Reports.
- Under Sales reports, select Average Order Value over time.
- Filter by date range, channel, or customer segment.
- Compare AOV trends against campaigns or discount codes.
Google Analytics 4 (GA4)
- Navigate to Reports → Monetization → Overview.
- Look for Average purchase revenue per user (equivalent to AOV).
- Use Explore to segment AOV by device, traffic source, or audience.
- Export or connect it with ad campaign data to optimize spend.
BigCommerce & WooCommerce
- Both show AOV in Dashboard → Reports → Orders Summary.
- BigCommerce also includes Revenue per order under Analytics.
- In WooCommerce, you can view it via the Analytics → Revenue tab or plugins like Metorik for deeper insight.
Klaviyo
- Go to Analytics → Metrics → Placed Order.
- Add a custom formula: Total Revenue ÷ Number of Orders.
- Track AOV per segment or campaign to refine email targeting.
For Zipchat users, AOV data can appear directly in your Zipchat dashboard alongside conversion metrics and proactive chat engagement data. You can also explore tier-based value under Pricing.
Calculating AOV and Revenue: RPV = Conversion Rate × AOV
Average Order Value (AOV) doesn’t just measure spend, it directly drives Revenue per Visitor (RPV), one of the most revealing key performance indicators in eCommerce. The relationship is simple but powerful:
RPV = Conversion Rate (CVR) × Average Order Value (AOV)
In other words, your ecommerce store earns more per visitor by either increasing how often people buy (CVR) or how much they spend when they do (AOV). Small shifts in either metric compound fast.

Testing matters: if a bundle upsell increases AOV by 15% but slightly reduces your conversion rate (CVR) by 5%, your RPV might still rise overall. Use this formula to weigh trade-offs before rolling out discounts or upsell flows.
High-performing brands pair AOV gains with customer retention metrics like lifetime value (LTV) to ensure short-term lifts don’t erode long-term profitability.
Set Your Free-Shipping Threshold from Typical Order Value
Your free-shipping threshold can make or break profitability. When you set it too low, you will lose margin, and when you set it too high, you risk scaring off customers. The best way to find your sweet spot? Start with your median order value and your checkout flow increases.
Example:
Median order value = $48
Target uplift = 20%
Suggested free-shipping threshold = $58–$60
This range encourages customers to add one more product without pushing them beyond their comfort zone. The idea is to incentivize slightly higher carts on your ecommerce website, while keeping your margins intact, this ultimately leads to more revenue.
In Zipchat’s upcoming AOV helper widget, you’ll be able to plug in your numbers and instantly see a recommended threshold, plus a margin alert if your shipping cost outweighs the incremental revenue.
You can further improve outcomes by optimizing product pages to highlight shipping incentives. Small tweaks like this can meaningfully increase conversion rate and overall revenue growth per visitor.
Increasing AOV Example: Policy Change → Measured Uplift
Let’s look at how one mid-sized apparel store turned a small pricing tweak into a meaningful AOV lift.
Inputs:
- Average order value before change: $45
- Monthly traffic: 80,000 visits (60% mobile, 40% desktop)
- Free-shipping threshold: $50
Actions:
- Increased the free-shipping threshold from $50 → $60.
- Added in-cart accessory recommendations (belts, socks, jewelry) using personalized prompts.
- Introduced post-purchase offers with 10% off complementary items (learn more here).
Outcome (after 30 days):
- AOV rose from $45 → $55 (+22%)
- Overall conversion rate stayed steady at 3.4%
- Net profit per order increased due to higher blended margin from accessories
How to replicate this for improved margins:
- Audit your median order size.
- Set a shipping threshold 15–25% above it.
- Layer in small, high-margin upsells (especially post-purchase).
- Measure AOV, margin, and return rate weekly for 4–6 weeks.
When tested systematically, these micro-adjustments create a compounding lift, higher AOV, stronger profitability, and higher revenue growth.
Proven Strategies to Increase AOV
Your AOV isn’t just a vanity metric, it’s a direct reflection of how effectively you’re maximizing each customer's journey. Here are ten proven, practical ways to get customers to spend more without feeling like they’re being upsold.
1. Bundle Products Smartly – Offer “Complete the Set” Deals
Product bundles simplify buying decisions while making customers feel like they’re getting more value for their money. Think skincare sets, kitchen essentials, or “starter kits” that naturally go together.
Why it works: Shoppers see product bundles as savings, even when the total cost is higher.
How to implement: Use analytics to identify frequently bought-together products and offer them as curated bundles with a slight discount. For example, “Buy a yoga mat + block + strap and save 10%.”
2. Upsell & Cross-Sell Intelligently – Suggest Meaningful Add-Ons
Upselling and cross-selling should feel like thoughtful recommendations, not pushy sales tactics.
Why it works: Customers trust brands that seem to understand their needs.
How to implement: Use behavioral data to suggest upgrades (“Upgrade to the premium plan for $5 more”) or complementary products (“Add a charger to your laptop for $20”). Keep suggestions relevant and proportional as small add-ons convert best.
3. Set Free Shipping Thresholds – “Spend $50 for Free Delivery”
This classic strategy never fails because it taps into psychology as customers hate paying for shipping.
Why it works: 73% of customers say free shipping influences their purchase decisions (Baymard Institute).
How to implement: Calculate your average AOV and set your free shipping threshold slightly above it, e.g., if AOV is $42, offer free shipping at $50. Add dynamic reminders like “You’re just $8 away from free shipping!”
4. Offer Limited-Time Discounts or Bonuses
Scarcity and urgency drive action. A limited-time offer can nudge hesitant buyers into adding that extra item.
Why it works: According to HubSpot, time-sensitive offers can boost conversions by up to 27%.
How to implement: Rotate flash sales, “Buy More, Save More” tiers, or exclusive add-ons (“Free tote bag today only”). Pair these with countdown timers or exit-intent popup to create urgency without pressure to encourage customers to make purchases.
5. Personalized Recommendations – Leverage AI Systems
Personalization is the modern growth lever. When recommendations feel curated, customers often spend more.
Why it works: McKinsey reports that personalization can lift revenue by 10–15%.
How to implement: Use AI-powered tools like Zipchat AI to analyze browsing behavior in your ecommerce store and the purchase history, then suggest tailored product categories or bundles. Imagine a chatbot saying, “Other customers who loved this dress also added these heels.” It feels personal, not promotional.
6. Customer Loyalty Programs & Reward Points
Rewarding loyalty turns one-time buyers into repeat spenders.
Why it works: 75% of consumers prefer brands that offer rewards (Bond Loyalty Report).
How to implement: Incentivize customers through the use of offer points for every dollar spent and give bonus incentives for reaching order milestones. Highlight how close customers are to their next reward — “Only 50 points away from a $10 voucher!”
7. Improve Mobile Checkout Experience
Mobile shopping is where most AOVs die — slow pages, cluttered carts, and friction-heavy checkouts.
Why it works: Every second of delay in mobile load time can reduce conversions by 7% (Google Data).
How to implement: Simplify your checkout to one page, enable digital wallets like Apple Pay, and auto-save shipping info to encourage repeat purchases. The smoother the process, the more items customers keep in their cart.
8. Use Behavioral Triggers – “You’re $10 Away from Free Shipping!”
Real-time nudges guide shoppers toward higher-value actions.
Why it works: Dynamic triggers play on momentum, once someone’s close to a reward, they’re more likely to add more.
How to implement: Set up progress bars or pop-ups during checkout showing cart milestones. For example, “Add one more item to unlock 10% off.” It turns buying into a game customers want to win.
9. Incorporate Live Chat & Real-Time Support (with Zipchat AI)
A confused shopper is a lost sale. Real-time support can clarify doubts, reduce WISMO (“Where is my order?”) messages, and even upsell.
Why it works: Customers who chat with brands spend 60% more per purchase (InvespCRO).
How to implement: Integrate Zipchat AI to proactively engage shoppers, not just answer questions, but suggest upgrades or bundles mid-conversation (“Want to add the matching case for 10% off?”), book a demo today. It is a support that sells naturally.
10. Optimize Product Descriptions & Visuals to Improve Margins
Clarity drives confidence, and confident customers spend more.
Why it works: High-quality visuals and detailed copy reduce uncertainty and returns.
How to implement: Use lifestyle imagery, 360° product views, and benefit-focused descriptions. Replace vague text (“high-quality fabric”) with specifics (“breathable organic cotton that resists shrinkage after 50+ washes”).
Monitor AOV (Cadence, Visuals, and QA)
Tracking your Average Order Value (AOV) isn’t a one-time metric check, it’s an ongoing performance pulse. Consistent monitoring helps you understand how pricing, promotions, and product mix impact your bottom line.
1. Cadence
Review AOV weekly for campaign responsiveness and monthly for trend validation. Weekly snapshots reveal quick shifts (like post-sale dips), while monthly rollups show sustainable growth patterns.
2. Visuals
Use a line chart for AOV over time and a histogram to visualize order value distribution, showing where most transactions cluster. This helps identify outliers or skewed averages caused by single large purchases.
3. QA (Quality Assurance)
Ensure your AOV data excludes refunds, partial shipments, and test orders. Maintain consistent definitions (gross vs. net) so insights remain trustworthy.
You can also pair AOV with related KPIs like customer lifetime value (LTV) and churn rate to understand not just how much people spend — but how long they keep buying.
Key Takeaways & Next Steps
Before you move on, here’s a quick recap of what matters most when it comes to Average Order Value (AOV):
- Know the average order value formula: AOV = total revenue ÷ total orders. This is your simplest window into how much customers spend per transaction, which allows you to increase AOV.
- Measure the right basis: Always distinguish between gross (includes shipping/tax) and net (excludes refunds/discounts) AOV for consistent reporting.
- Pick high-impact tactics: Focus on 1–2 proven levers, like strategic bundles or free-shipping thresholds to lift AOV without hurting conversion rates.
Once your AOV foundation is solid, you can scale smarter: optimize upsells, test pricing tiers, and personalize offers with AI-driven tools like Zipchat.
Start your free trial or explore Pricing to see how Zipchat helps boost your AOV automatically.
Average Order Value (AOV): FAQs
What is Average Order Value (AOV)?
AOV measures how much, on average, each customer spends per order. It’s a core ecommerce KPI that reveals purchase behavior and pricing effectiveness. Learn more in the AOV definition section.
What is the AOV formula?
The formula is AOV = Total Revenue ÷ Number of Orders. For example, $10,000 ÷ 200 orders = $50. See our AOV formula breakdown for variables and common mistakes.
Does AOV include shipping and tax?
That depends. Gross AOV includes shipping/tax, while Net AOV excludes them and adjusts for discounts or refunds.
AOV vs. ASP vs. ARPU—what’s the difference?
AOV = per order, ASP = per product sold, ARPU = per user over time. Each tells a different story about monetization.
How often should I track AOV?
Track weekly for tactical shifts (promos, pricing) and monthly for trend analysis.
Where can I find AOV in Shopify or GA4?
In Shopify, navigate to Analytics → Reports → Average order value. In GA4, go to Monetization → Overview.
What’s a good AOV in my industry?
Benchmarks vary — apparel brands average $70–$100, electronics often exceed $150, and beauty hovers around $60. Use these only as rough guides; trends shift quarterly. Combine AOV with conversion rate (CVR) for a truer picture of performance.

Try Zipchat for free