Try Zipchat in Action!
Enter your store URL to see how Zipchat would behave.


What Is a Customer Health Score? — Definition, Formula & Template
A customer health score (CHS) is a composite metric that measures the overall strength and sustainability of a customer relationship by combining behavioral, transactional, and sentiment signals like product usage, support activity, and NPS into one actionable index that predicts renewal, expansion, or churn risk (Gainsight, 2024).
In plain terms, your customer health score is a weighted average of all the factors that indicate customer “health” which determines engagement, adoption, business outcomes, and customer satisfaction. It’s not a single data point but a living signal that reflects how likely a customer is to stay, buy more, or leave.
When product usage is combined with support interactions and NPS surveys, it gives a more holistic view of account vitality than revenue or retention alone. A customer with strong adoption but declining engagement scores might look “healthy” in MRR terms, but is silently trending toward churn.
Customer health score formula:
Score = Σ (weight_i × normalized_metric_i)
Modern customer success and e-commerce teams use customer health scores to:
- Forecast churn before it happens
- Prioritize retention and expansion resources
- Quantify the impact of engagement and support strategies
Think of it as a live heartbeat for your customer base, one that you can measure, score, and act on.
Why Customer Health Scores Matter (Business Outcomes)
A customer health score is not just another useful metric; it is a leading indicator of business performance. When this scoring system is used correctly, it connects customer experience to revenue outcomes, helping customer success leaders focus on what truly drives customer outcomes and retention.
Here’s why it matters:
Predicts churn before it happens
According to Vitally (2024), brands using customer health scores reduce churn by up to 27% through early intervention programs. A dip in usage or sentiment can trigger proactive outreach, preventing unhappy customers from leaving.
Drives smarter customer retention strategies
Sales teams can segment “at-risk” vs. “expansion-ready” customers and tailor retention strategies accordingly. This allows you to focus more on customer-centricity, leading to achieving the desired customer success.
Links customer success to revenue
HubSpot reports that accounts with a “healthy” score renew at 2.5× the rate of unhealthy ones, which is clear proof that customer health score isn’t a vanity metric but a growth lever that drives customer success scores.
Enables accurate forecasting
Assigning weight based health scores correlate with renewal probability, upsell likelihood, and overall lifetime value (LTV). This helps CROs and finance teams project ARR stability with higher confidence.
Improves resource allocation
By highlighting high and low-risk cohorts, teams can prioritize product training, support resources, or customer loyalty campaigns where they’ll have the most impact.
Example: Customer Health Score → Business Outcome
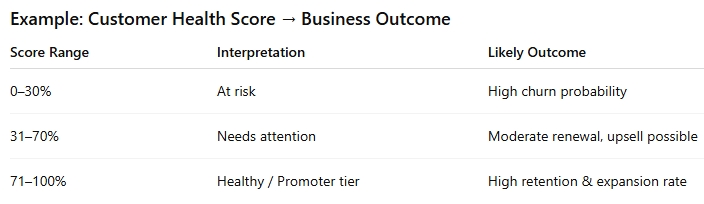
When aggregated across customers, customer health score becomes a portfolio-level signal that shows how your retention and marketing efforts are performing in real time. This is why leading SaaS and e-commerce companies now report it alongside NPS and ARR as part of their customer capital dashboard (Paddle, 2025).
Signals to Include to Avoid Common Pitfalls (Events, Surveys & Support Telemetry)
A customer health score is only as good as the signals feeding it. To make it meaningful, your instrumentation needs to capture how customers use, feel about, and interact with your product or store. In other words, behavior + sentiment + outcomes lead to customer success.
These signals fall into five primary categories:
1. Product Usage & Engagement
Usage patterns show how often and how deeply customers engage with your product or store.
Industry benchmarks (Gainsight, 2024) suggest that feature adoption frequency and login consistency are among the strongest health predictors.
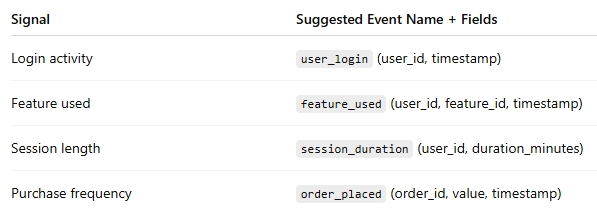
Time window: Analyze over 30–90 days to account for seasonal activity.
2. Customer Experience Feedback & Surveys
Customer sentiment validates quantitative usage data. A mix of structured and open-ended surveys provides richer insight and better data-driven decisions.
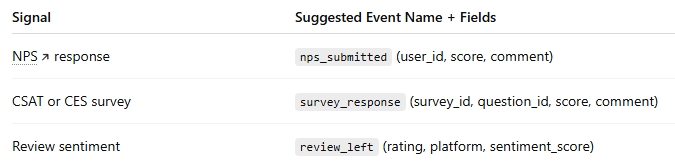
Pro tip: Normalize survey scales (e.g., 0–10) before weighting them in your score formula.
3. Support Interactions
Customer frustration or long response times are early churn signals. Tracking support interactions adds a powerful qualitative layer that can lead to better customer satisfaction.
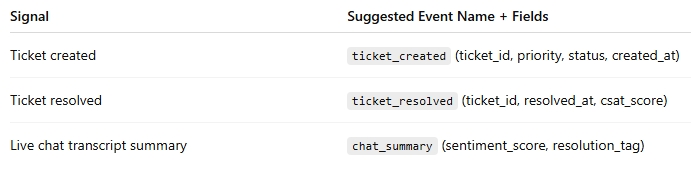
Time window: Rolling 60-day average gives a balanced signal between volume spikes and systemic issues.
4. Revenue & Renewal Behavior
Transactional data reflects how healthy accounts act financially. According to HubSpot (2025), including renewal history improves churn prediction accuracy by up to 22%.
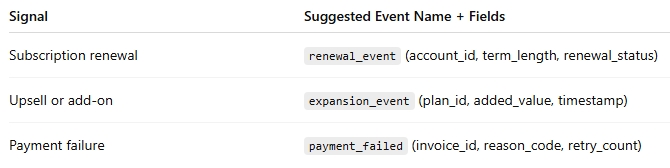
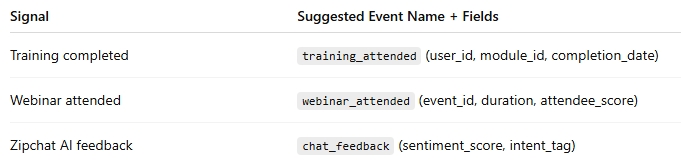
5. Proactive Engagement & Education
Don’t forget the “success” side, training sessions, webinar attendance, or Zipchat AI-powered VOC transcripts can all show customer commitment.
Calculating Customer Health Scorecard (Formula + Worked Example)
A customer health score is a weighted composite metric that quantifies customer engagement, sentiment, and financial signals on a 0–100 scale.
Here’s the core formula:

Each metric (e.g., product usage, NPS, support interactions) is normalized between 0 and 100, then multiplied by its assigned weight. The sum of all weighted contributions gives the final Customer Health Score (CHS).
Step-by-Step Example
Let’s calculate the Customer Health Score (CHS) for an e-commerce subscription business.
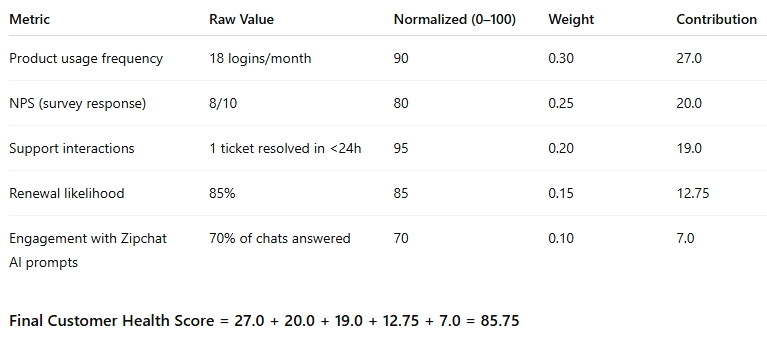
How Normalization Works
To normalize raw values, map each metric to a 0–100 scale:
- High usage: top quartile = 100, bottom quartile = 0
- NPS: (Score ÷ 10) × 100
- Support: faster resolution → higher score (inverse scaling)
- Renewal: predicted renewal probability (%)
- Engagement: direct % of proactive message response
Industry examples (Vitally, 2024; HubSpot, 2025) show that companies using dynamic normalization windows (rolling 90 days) see up to 18% better churn prediction accuracy.
Worked Example Summary
Implementation Tip
Once you’ve set up your weights, automate updates weekly via your CRM or product analytics tool. Many teams integrate Zipchat AI to analyze VOC data from transcripts and flag customers with low health scores.
Implementation Appendix — Event Schema & Sample SQL
Building a Customer Health Score (CHS) that actually scales requires a clear event schema and structured data model. Below is a developer-ready appendix with SQL examples you can copy and adapt for your own product analytics or CRM pipeline.
Minimal Data Model
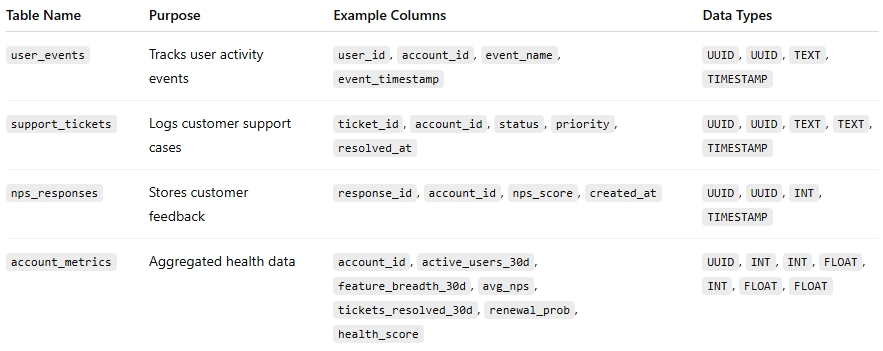
This schema allows you to aggregate activity and sentiment data into a unified account-level view, which is the foundation for automated scoring in BI tools or CDPs like HubSpot or Gainsight.
SQL #1: 30-Day Active Users
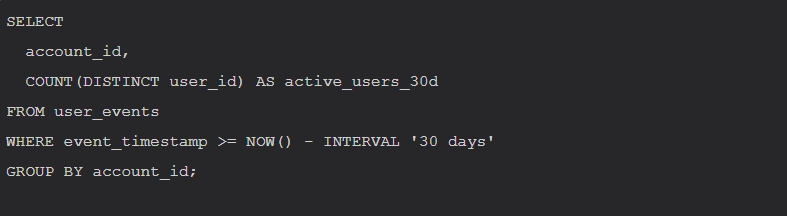
This query measures user engagement frequency, one of the strongest churn predictors according to Gainsight (2025). Use this as a baseline metric in your weighted scoring model.
SQL #2: Feature Breadth (Distinct Features Used)

Feature breadth captures product adoption depth, where teams with more diverse feature usage often show 25–30% higher renewal likelihood (Vitally, 2024).
SQL #3: Final Score Aggregation
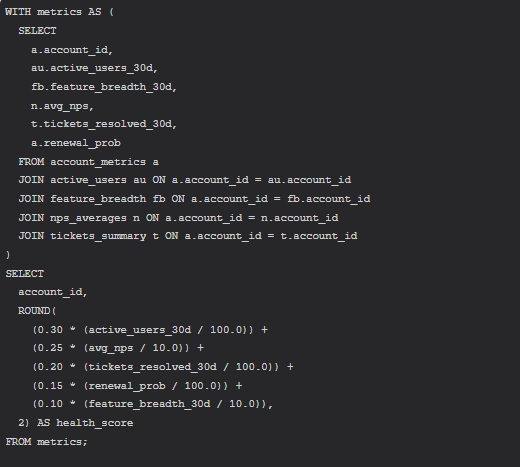
This shows the normalized metric and outputs of a composite health_score per account. You can adjust weights in your health score template or integrate this SQL directly into your analytics pipeline.
Pro Tip: Automate & Monitor
- Run weekly refreshes and store results in your data warehouse (BigQuery, Redshift, Snowflake).
- Visualize in dashboards like Looker or Metabase to track trends over time.
- Connect to Zipchat AI to identify low-score customers automatically and trigger proactive retention workflows.
Customer Segmentation & Threshold Examples (SMB / Mid-Market / Enterprise)
Not every customer health score (CHS) should be interpreted the same way. A small e-commerce brand using Shopify has completely different engagement signals and renewal patterns than a 5,000-seat enterprise. That’s why segmentation matters; your thresholds and weights must scale with business complexity.
Why Segment Your Health Scores?
Segmentation ensures that health scoring reflects what customer success actually looks like for each type of customer.
According to Gainsight (2025) and HubSpot’s 2024 State of Service Report, companies that tailor their scoring by segment see up to 38% better churn prediction accuracy and 20% faster retention response times.
Example: Segment-Specific Weighting & Thresholds

How to Adjust Thresholds
- Usage-heavy SMBs: Prioritize engagement events (login frequency, feature breadth).
- Mid-market teams: Combine quantitative metrics with customer journey milestones (e.g., integrations completed).
- Enterprise accounts: Layer in qualitative CSM feedback and contract renewal probability from CRM data.
You can explore more about scaling health analytics in your health-score thresholds for enterprise section.
Pro Insight
As Qualtrics (2025) notes, the most mature programs continuously recalibrate thresholds every quarter using actual churn data. In other words, your CHS isn’t static. It’s a living system that evolves as your customer base and product maturity grow.
Validate the Score & Compute ROI
Building a customer health score (CHS) is just the start; proving it works is where the ROI lives. This section shows how to validate your score’s predictive power, link it to retention outcomes, and calculate its business impact.
Step 1: Validate Customer Health Metrics with Cohort Testing
To ensure your health score is meaningful, run a simple cohort validation test:
- Take historical data of customers with known churn or renewal outcomes.
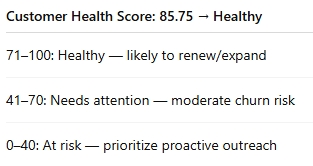
- Group them by prior health score bands (e.g., 0–40, 41–70, 71–100).
- Compare churn or retention rates across cohorts.
According to Vitally, companies that run biannual validation see an average 22% improvement in churn prediction accuracy within two quarters.
If your “Healthy” group renews at 90% while your “At-risk” group renews at 60%, your score is doing its job.

Step 2: Quantify ROI
Once validated, translate retention improvements into monetary value.
Use this simple formula to estimate ROI:

Where:
- Retention Lift = Difference in retention rate before vs. after CHS implementation
- ARPA = Average Revenue Per Account
- Cohort Size = Number of accounts in your measurement group
Example:
If a 5-point improvement in health score corresponds to a 2% higher retention rate across 1,000 accounts with an ARPA of $1,200, your ROI looks like this:

Even modest lifts compound quickly and, HubSpot found that teams using data-driven health scoring achieved 1.5x higher customer lifetime value (LTV) over 12 months.
Step 3: Add an ROI Worksheet to Your Template
When you download the free ROI worksheet, then:
- Plug in retention rates before/after scoring.
- Auto-calculate retention lift and ARR uplift.
- Visualize ROI trends over time.
Pro tip: Re-run this validation every quarter; it’s not just a one-time audit. The most mature SaaS and e-commerce teams (per Gainsight, 2025) integrate CHS validation into their QBR dashboards to keep the metric operationally relevant.
Governance, Recalibration & Versioning Checklist
A customer health score isn’t “set and forget.” Like any right metric, it needs structure, ownership, and version control to stay accurate and trusted. This section outlines how to govern and recalibrate your customer health score so it remains reliable quarter after quarter.
Ownership & Accountability
A good health score has a clear owner, usually the Customer Success Operations (CS Ops) or Revenue Operations team. They ensure consistency across departments and act quickly as the single source of truth for changes.
Recommended roles:
- Primary Owner: CS Ops Manager or Analyst
- Stakeholders: CSMs, Data/Analytics, Product, and Marketing Ops
- Approvers: Head of CS or CRO
Cadence: Review & Recalibrate Quarterly
Run a quarterly calibration to keep your health score aligned with business realities:
- Review correlations between customer health scorecard and retention metrics.
- Check for drift. Are “Healthy” accounts still renewing at expected rates?
- Adjust weights or thresholds based on new product usage trends.
- Document all changes in a version log.
Example: If engagement now contributes more to retention post-launch of a major feature, increase its weight from 25% → 35%.
Versioning & Change Control
Treat your customer health score like code. Use semantic versioning (e.g., v1.0 → v1.1) and maintain a changelog:
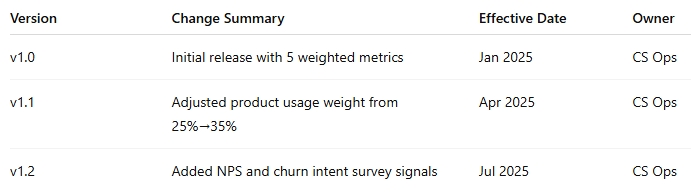
Governance & Calibration Checklist
Use this before each rollout:
- Confirm data source accuracy (event logs, CRM syncs)
- Validate metric normalization and weights
- Review quarterly drift vs. retention outcomes
- Log changes in version control (e.g., chs_version_log.sql)
- Communicate updates to CSM and RevOps teams
- Re-run cohort validation after each major version
- Archive superseded formulas
When governance is formalized, your health score becomes a living system, not a static dashboard metric. It earns trust across departments and evolves in lockstep with your product, customer base, and revenue goals.
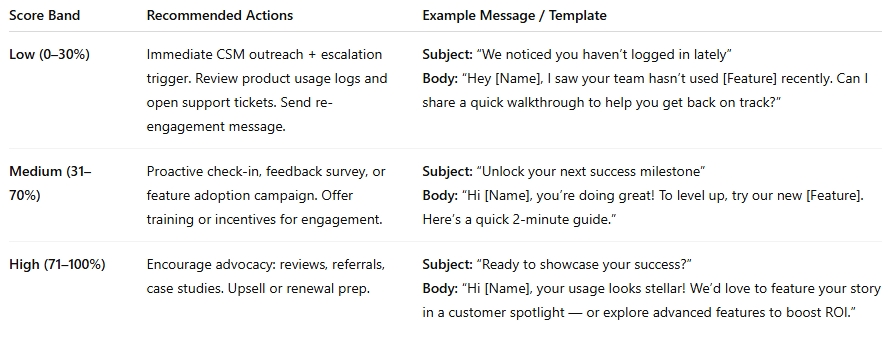
Playbooks: Actions for Low, Medium, and High Scores
Once your customer health score is live, the real value comes from what you do with it. Clear playbooks help teams act fast, personalize outreach, and prevent churn before it happens. Below are tactical responses for each score band ready to automate or plug into your CRM workflow.
Score Band Playbook Overview
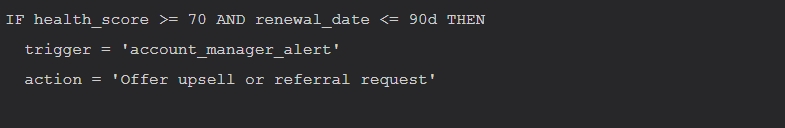
Automation Rules (Example)
Low Score Alert

Medium Score Nurture

High Score Expansion
Operational Notes
- Low-score playbooks focus on retention triage, pair with customer retention strategies to close the loop.
- Medium-score customers benefit most from guided product education and feedback loops, which is perfect for CS-led nurture campaigns.
- High-score customers are your brand multipliers, prompt them for testimonials or pilot new feature betas.
Pro Tip
Automate your scoring system through your helpdesk or CRM (e.g., Zendesk, HubSpot, or Intercom). For example:
“Trigger Zendesk ticket when score < 30 and last_login > 30 days.”
This turns your customer health score from a passive metric into a proactive growth engine, one that scales loyalty, renewals, and expansion without manual monitoring.
Tools, Templates & Further Reading
Before you build or refine your customer health scoring system, make sure your team has the right data stack, templates, and references to move from idea → implementation quickly. This curated list includes hands-on tools, trusted vendor resources, and downloadable assets used throughout this guide.
FAQ Snapshot
What is a customer health score?
A composite metric that predicts churn or growth likelihood by tracking engagement, feedback, and support signals.
How often should I recalculate scores?
Quarterly for stable segments; monthly for fast-moving SMBs.
What customer data sources do I need?
Product analytics, CRM, and support systems — unified by account ID.
How do I prove ROI?
Track retention lift in test cohorts and apply the formula:
ROI = (retention_lift × ARPA × cohort_size).
Can I automate playbooks by score?
Yes. Connect your CRM or CS platform to trigger outreach when thresholds are crossed.
What’s the ideal tool stack?
A mix of product analytics (Mixpanel, Amplitude), CRM (HubSpot), and AI chat platforms like Zipchat for real-time sentiment capture.
Next Steps: Implement Your Customer Health Score
You’ve now got the full blueprint, from signal selection and SQL setup to ROI validation and governance. The next step is turning your model into motion. Whether you’re a CS leader, data analyst, or product owner, start small: pick 3–4 key metrics, apply weights, and measure outcomes over one quarter.
Ready to Automate with Zipchat?
Connect real-time chat, support data, and product telemetry to power predictive health scoring across your customer base.
Start Free Trial→
Implementing a customer health score isn’t just an analytics project; it’s a retention engine.
The sooner you begin tracking and iterating, the faster you’ll uncover which signals truly predict renewal, expansion, or churn.

Try Zipchat for free